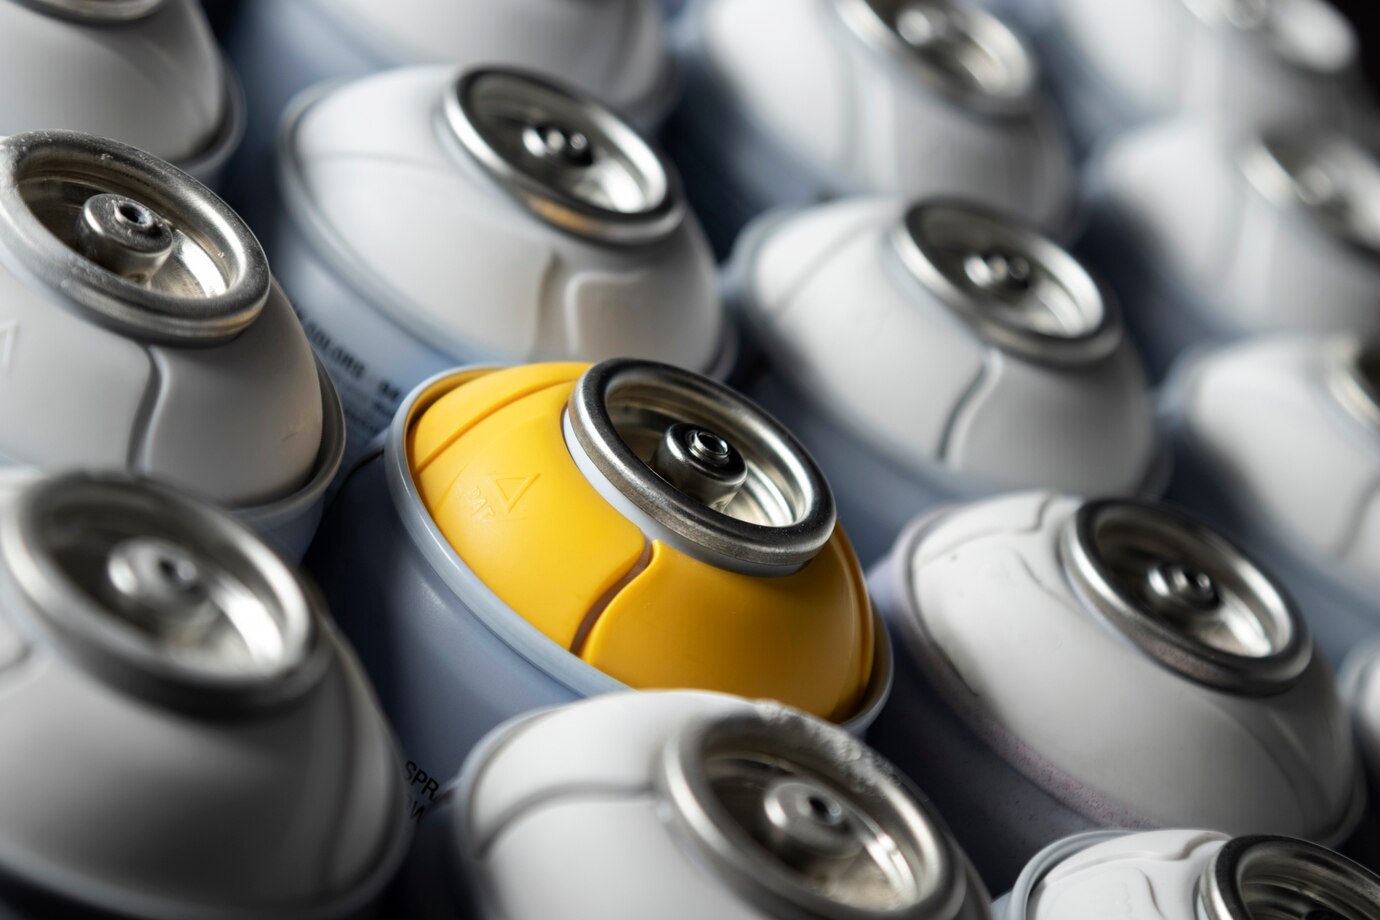
Opening: Energy storage cells - the "core engine" of energy transformation
The global energy storage cell industry is reshaping the energy landscape at an unprecedented speed. In 2023, the global energy storage cell production capacity will exceed 800GWh, and China will dominate the market with a 72% share, but geopolitical and technological changes are giving rise to a new pattern (data source: SNE Research). The US Inflation Reduction Act (IRA) and the European Critical Raw Materials Act (CRMA) are accelerating the localization process. Japan and South Korea rely on technology patents to hold on to the high-end market, while Southeast Asia attracts global investment with its resource endowments. At the same time, the commercialization of new technology routes such as solid-state batteries and sodium-ion batteries is accelerating, and the market size is expected to reach US$300 billion in 2030 (Bloomberg New Energy Finance). This competition is not only about the expansion of production capacity, but also a multi-dimensional contest of technology routes, supply chain resilience and policy games.
Global battery cell production base structure: Comparison of advantages and disadvantages of the six core regions
1. China: scale effect and advantages of the entire industry chain
Production capacity: By 2023, the production capacity will reach 580GWh, accounting for 72% of the world (dominated by CATL, BYD, and EVE Energy).
Core advantages:
- The cost of lithium iron phosphate (LFP) is the lowest in the world (0.5 yuan/Wh, 40% lower than Europe and the United States).
- Vertically integrated industrial chain (lithium ore → precursor → battery cell → recycling).
Policy support: mandatory storage and electricity spot market pilot.
Main challenges:
Capacity utilization is less than 60% (Q4 2023).
Access to European and American markets is restricted (IRA localization clauses, EU carbon tariffs).
Representative projects: CATL’s German factory (14GWh), BYD’s Brazilian base (10GWh).
2. The United States: a breakthrough in localization driven by policies
Capacity scale: 45GWh in 2023, IRA pushes for 200GWh target by 2025.
Core advantages:
- The RA tax credit covers 45% of the battery cell cost (Tesla and GM benefit).
- Mass production of 4680 batteries (energy density 300Wh/kg, cost reduction of 15%).
Main challenges:
- Graphite and cobalt rely on imports (China accounts for 60% and the Democratic Republic of the Congo accounts for 75%).
- Labor costs are 2.5 times that of China.
- Representative projects: Tesla's Nevada Gigafactory (100GWh), GM-Samsung SDI joint venture (30GWh).
3. Europe: Green transformation and supply chain anxiety
Production capacity: 25GWh in 2023, 400GWh target in 2030.
Core advantages:- Green electricity costs are as low as 0.03 EUR/kWh (Norwegian hydropower).
- With the rise of new forces such as Northvolt, the demand for localization is strong.
Main challenges:
- The self-sufficiency rate of lithium resources is less than 5%, and the country relies on imports from South America.
- The cost of battery cell manufacturing is 35% higher than in China.
- Representative projects: Northvolt Swedish factory (60GWh), Volkswagen Salzgitter base (40GWh).
4. Japan and South Korea: The paradox of technology patents and market loss
Production capacity: 80GWh in 2023 (Panasonic, LG Energy Solution, SK On).
Core advantages:
- Ternary material patent barriers (LG New Energy NCMA battery).
- Leading in solid-state battery research and development (Toyota will start mass production in 2027).
Main challenges:
- The layout of lithium iron phosphate is lagging behind (market share is less than 5%).
- European market share fell from 40% to 25%.
Representative projects: Panasonic's Kansas factory in the United States (4680 battery), LG Energy Solution Indonesia base.
5. Southeast Asia: Resource Positioning and Cost Depression
Capacity scale: 30GWh in 2023, mainly in Indonesia and Vietnam.
Core advantages:
- Indonesia has the largest nickel ore reserves in the world (21% of the total).
- Labor costs are only one-third of those in China.
Main challenges:
- Policy fluctuations (Indonesia bans the export of raw ore).
- The industrial chain is incomplete and relies on equipment imports.
Representative projects: CATL's Morowali base in Indonesia (60GWh) and Gotion High-tech's Vietnam factory (5GWh).
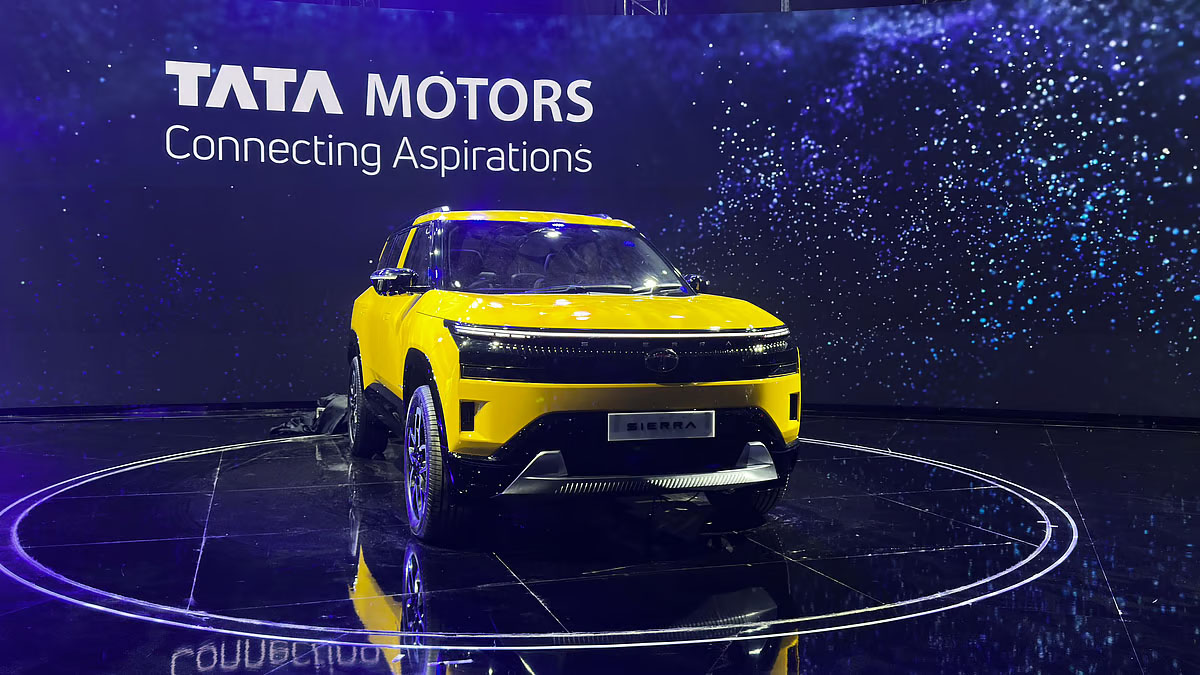
6. India: Subsidy-driven localization ambitions
Production capacity: 5GWh in 2023, 50GWh target in 2030.
Core advantages:
- The PLI scheme provides a subsidy of Rs 24,000 crore.
- The renewable energy installed capacity target is 500GW (2030).
Main challenges:
- Chip manufacturing costs are 40% higher than in China.
- Chinese equipment and technology licensing.
Representative project: Tata Group’s Gujarat plant (planned 20GWh).
Table 1: Comparison of advantages and disadvantages of global battery cell production bases (2023)
| area | Production capacity (GWh) | Cost ($/kWh) | Technical route | Advantages | Disadvantages |
| China | 580 | 90-110 | LFP-based | Full industry chain, lowest cost | Overcapacity and international trade barriers |
| USA | 45 | 130-150 | Three yuan + 4680 | Policy subsidies and technological innovation | Material dependence and high labor cost |
| Europe | 25 | 150-170 | Ternary + solid | Green electricity at low prices and local demand | Resource shortage and cost disadvantage |
| Japanese and Korean | 80 | 120-140 | Ternary + solid | Patent barriers, advanced equipment | Iron-lithium lags behind and market share is lost |
| Southeast Asia | 30 | 100-130 | LFP+Nickel | Rich resources and cheap labor | Policy fluctuations and weak technology |
| India | 5 | 140-180 | LFP | Subsidy incentives, market potential | Incomplete industrial chain |
Technology route competition: Iterative logic from LFP to solid state
Lithium iron phosphate (LFP): The era of cost dominance
Market share: 75% (2023), fully adopted by Tesla Megapack and BYD Blade Batteries.
Performance breakthrough: cycle life reaches 12,000 times (CATL’s third-generation battery cell), suitable for grid-side energy storage.
Global expansion: The penetration rate of household energy storage in Europe exceeds 40%, and the US IRA policy forces localized production.
Ternary materials (NCM/NCA): the last bastion of the high-end market
Application scenarios: high-end household energy storage (European villas), aerospace special power supplies.
Technology upgrade: The cobalt content of LG Energy Solution's NCMA battery is reduced to 5%, and the cost is reduced by 15%.
Market contraction: share falls from 80% in 2019 to 20% in 2023 (SNE Research).
Next-generation technology: the tipping point of disruptive change
Solid-state batteries:
- Toyota sulfide route (mass production in 2027, energy density 500Wh/kg);
- QuantumScape oxide route (installation in 2026, investment from Volkswagen).
Sodium-ion batteries:
CATL's second-generation sodium battery costs 0.4 yuan/Wh (2025 target), and it focuses on the low-end market.
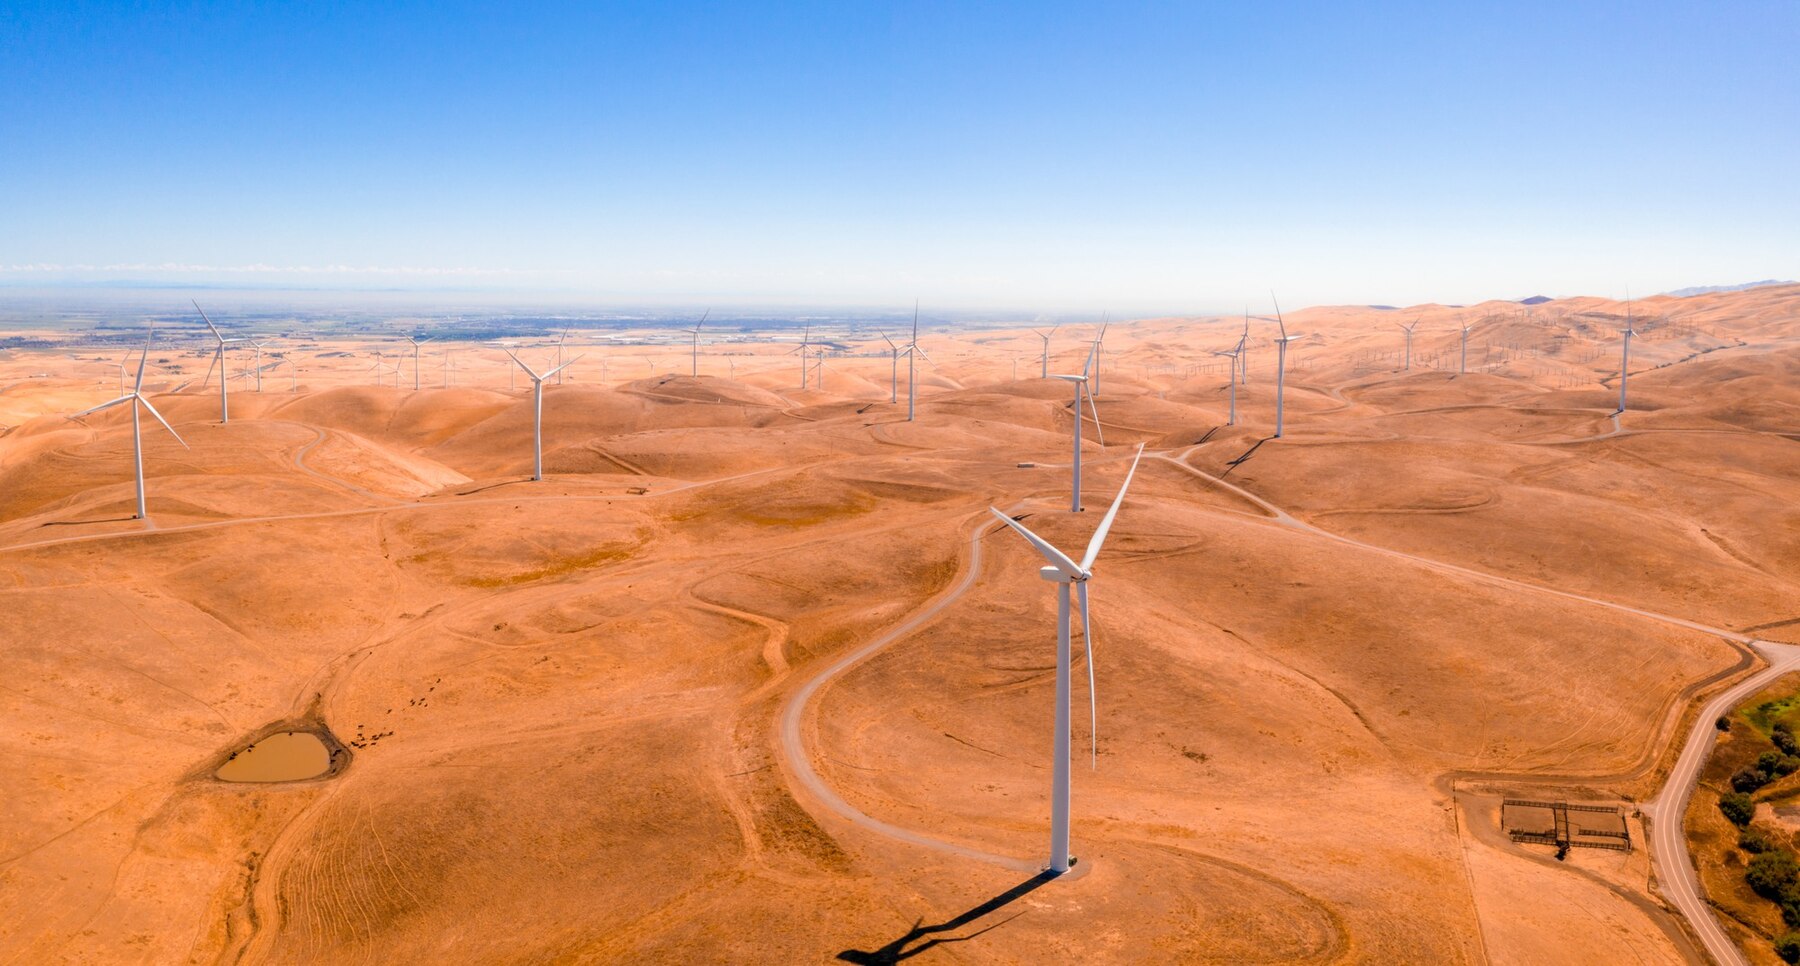
Hydrogen energy storage:
Saudi Arabia's NEOM project is equipped with 4GW of green hydrogen production capacity, and the long-term energy storage cost target is $1.5/kg (2030).Core Challenge: The Triangle of Resources, Policies and Standards
1.Rise of nationalism
Competition for lithium mines: China’s dependence on lithium imports is 70%, and CATL is bidding for mining rights in Argentina’s salt lake.Nickel ore game: Indonesia requires foreign companies to process locally, and Chinese companies invest more than US$12 billion to build factories.
Graphite crisis: China’s export controls force Europe and the United States to accelerate substitution (U.S. Syrah expands production to 40,000 tons/year).
2. Geopolitical shocks
The US IRA Act: The localization rate of battery cell components will reach 100% in 2029. CATL circumvents restrictions by licensing technology (in cooperation with Ford).
EU CRMA: The self-sufficiency target for lithium and nickel is 20% (2030), restricting imports of raw materials from China.
Carbon barrier upgrade: EU battery passport system increases compliance costs by 15% (CATL’s German factory’s carbon footprint needs to be reduced by 40%).
3. Standardization fragmentation and patent blockade
Safety standards: China's GB/T 36276 and EU's IEC 62619 are incompatible, pushing up export certification costs.
Patent barriers: Japan and South Korea hold more than 60% of the core patents for solid-state batteries, while China's Weilan New Energy has taken a detour to develop oxide-based batteries.
Future Trends: Industry Restructuring from 2025 to 2030
Rebalancing of production capacity distribution
China's share has declined from 72% to 60% (impact of localization policies in Europe and the United States).
The rise of North America: The share of US production capacity increased from 6% to 20% (driven by IRA).
Southeast Asian expansion: Indonesia’s nickel ore-driven production capacity accounted for 15%.
Technological diversification and scenario differentiation
2025: LFP accounts for 70%, and sodium ions break through the low-end market (5% share).
2027: Solid-state batteries are commercialized (10% high-end market).
2030: Hydrogen energy storage enters the long-term track on the grid side.
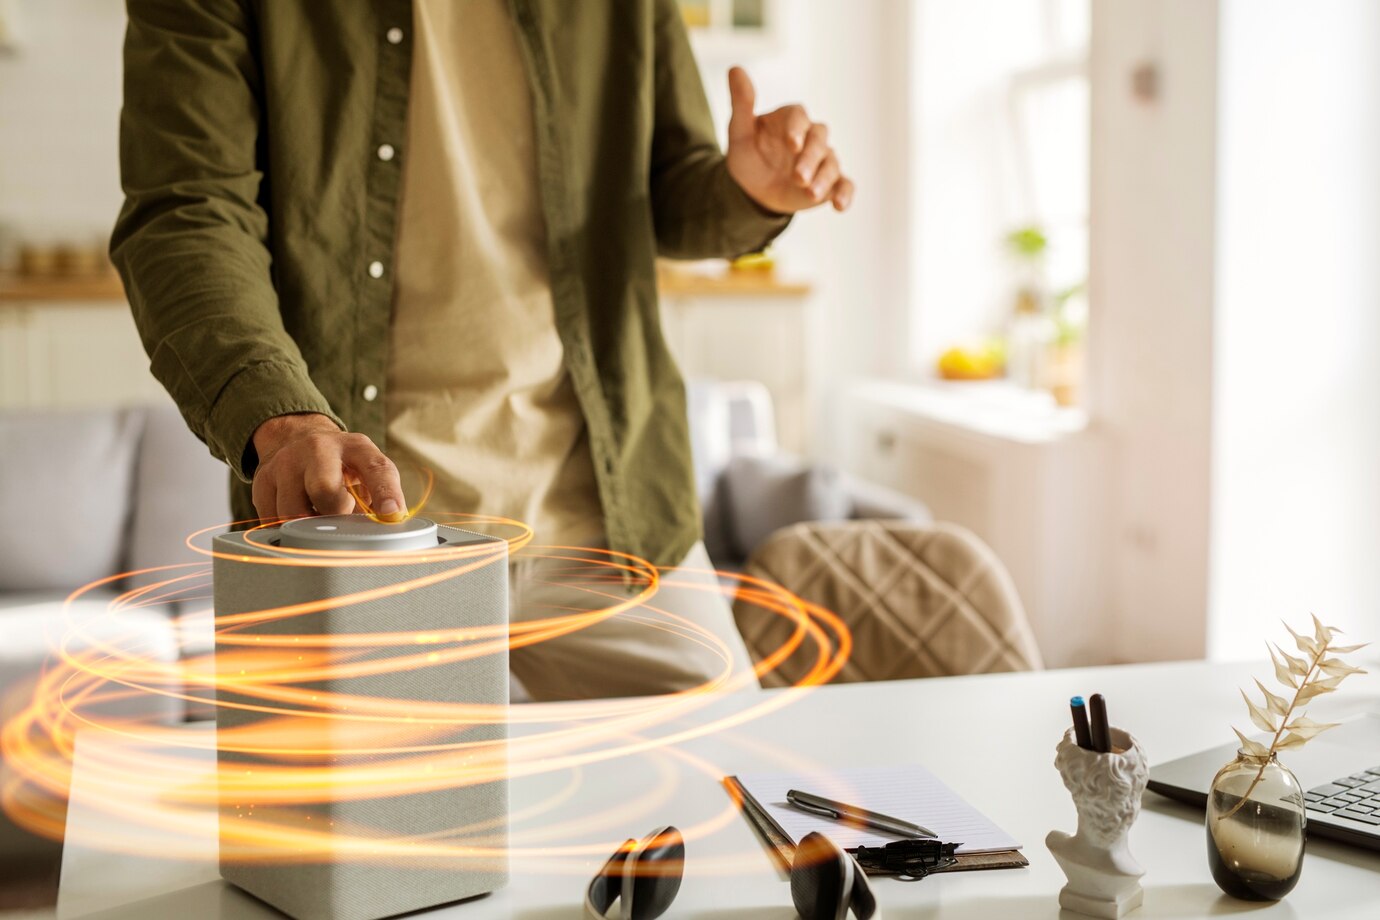
Business model innovation
Battery Bank: CATL launches a leasing model where users pay for energy storage services on demand.
Recycling economy: Redwood Materials aims to recycle 50% of global lithium demand by 2030.
Digital operations: Huawei's intelligent photovoltaic storage cloud platform connects to over 100GW of assets and optimizes charging and discharging strategies.
Energy storage cells - the reconstructor of the global energy order
The global energy storage cell industry is undergoing a profound transformation from "cost competition" to "all-dimensional capability competition". China is currently in the lead with its scale and industrial chain advantages, but Europe and the United States are catching up through policy leverage and technological innovation, while Japan and South Korea are defending the high-end market with patent barriers. In the next decade, the winner will be determined by three major capabilities:
Supply chain resilience: whether a supply network with independent resources and controllable geopolitical risks can be built;
ESG compliance: achieving low-carbon production and ethical sourcing to cope with global regulatory upgrades;
Technology commercialization: Convert laboratory breakthroughs into mass production competitiveness, especially the speed of implementation of solid-state and sodium batteries.
For investors, it is important to focus on companies with leading technology, high ESG ratings, and diversified supply chains, such as CATL, Northvolt, and QuantumScape. However, geopolitical conflicts, resource nationalism, and technological black swan events are still risks that cannot be ignored. In this race to reshape the energy order, only participants with innovation, adaptability, and a global vision can win the final game.
Latest News


Ms. Liu +86 132 6100 0097
协办单位:全国工商联新能源商会、电力规划设计总院
支持单位:江苏省发展和改革委员会、江苏省工业和信息化厅、江苏省商务厅
国网江苏省电力有限公司
国际支持:欧洲储能行业协会、德国智能城市交通协会
承办单位:创能国际会展服务(江苏)有限公司、东浩兰生会展集团股份有限公司
溧阳深水科技咨询有限公司


